
Two-dimensional Electrophoresis of End-labeled Genomic DNA Fragments
The author describes a highly efficient method that allows the simultaneous examination of more than 2000 DNA fragments for germinal mutations.
by Jun-ichi Asakawa, Laboratory of Biochemical Genetics, Department of Genetics, RERF
This article was originally published in RERF Update 7(1):3-5, 1995.
A principal focus of our research group is the study of spontaneous and induced germinal mutations caused by ionizing radiation in humans. We have been continuously searching for more efficient and more specific approaches than those of the past. Three years ago (December 1991), I encountered an interesting technique, presented by I Hatada et al of the National Cardiovascular Center Research Institute at the 14th Meeting of the Molecular Biology Society of Japan. I was greatly impressed by their new two-dimensional electrophoresis (2-DE) approach, which provided over 2000 DNA fragments (spots) from a genomic DNA digest without using any probes. This method, which they referred to as restriction landmark genome scanning, has utility in analyzing genomic alterations, including deletions and amplifications. To this end, we have refined this 2-DE technique as a mutation-screening method and have explored its potential use in our studies. To analyze the complex patterns of variation, we use computer algorithms developed for 2-DE protein gels by a research group of James V Neel and Samir M Hanash at the University of Michigan; computer analysis was carried out by computer scientist Rork Kuick. In this article, I will describe the present status of our efforts to identify in humans quantitative and qualitative variation in DNA spots visualized on autoradiographs of 2-DE sheet gels.
Basic steps of 2-DE
A genomic DNA is digested with restriction enzymes NotI and EcoRV (see Figure 1). The protruding ends produced by NotI are filled with 32P-labeled deoxynucleotides by T7 polymerase (as shown in blue in Figure 1). This specific isotope-labeling of the NotI sites is the key distinction of the 2-DE approach and results in specific visualization of DNA fragments containing the NotI site at one or both ends. The NotI sites are disproportionately frequent in the unmethylated “CpG islands” so common at the 5′ end of genes. Thus, the use of NotI as a restriction landmark enzyme may result in the derivation of a high proportion of the visualized fragments from active genes. The development of the current first-dimensional electrophoretic procedure has involved considerable experimentation. The RERF biochemical genetics program has used extensively in the past a disc gel electrophoretic system to study protein variants, and this system has been adapted for the DNA gels. After considerable experimentation, we obtained the best results with an agarose disc gel cast in Teflon tubing, with an inner diameter of 2.4 mm and 60 cm in length. I found that the uneven inner surface of the Teflon tubing stabilized the position of the agarose gel during electrophoresis. About 1 microgram of DNA sample was electrophoresed. After electrophoresis for about 40 hours, the 32-cm portion of the disc gel containing DNA fragments approximately 1-5 kb in length was expelled from the tube and was incubated with restriction enzyme HinfI. The HinfI-digested DNA fragments were further separated perpendicularly on a polyacrylamide sheet gel (35 x 50 cm). The gels are dried and autoradiographed.
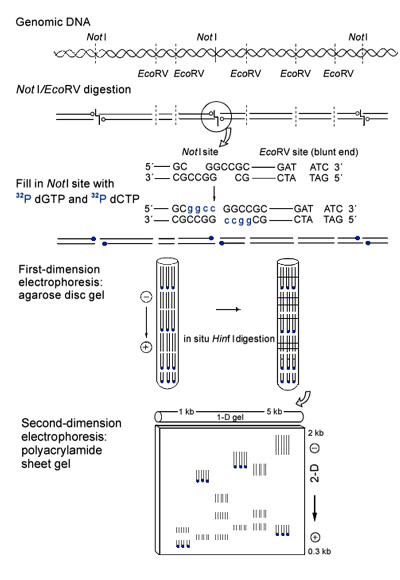
Figure 1. The refined DNA 2-DE method. See Basic steps of 2-DE for a detailed explanation.
A digital image of the area of the autoradiogram analyzed is shown in Figure 2. On a single 2-DE DNA preparation made according to our conditions, approximately 2000 spots are visualized. The intensity of any spot that appears on the gel is usually expected to be determined by two homologous DNA fragments. In principle, this system will detect genetic variation of two types: 1) that due to gain or loss of a cut site for the three restriction enzymes employed in the study and 2) that due to insertion/deletion/rearrangement (I/D/R) events. In the presence of a detectable variant in fragment length resulting from either 1) or 2) above, only one DNA fragment would be at the usual position, and the autoradiographic intensity of this spot should decrease by one-half. With respect to the variant fragment, it will either migrate to an altered position on the gel (a new spot), not enter the gel, or migrate off the gel. New spots may also appear on the gel as a result of variation in a fragment that does not normally appear on the gel. Some I/D/R events could eliminate a second fragment. With respect to either 1) or 2) above, homozygosity for the variant should be associated with the total disappearance of the corresponding normal spot. To enter into genetic analysis, these fragments must exhibit positional and quantitative stability.
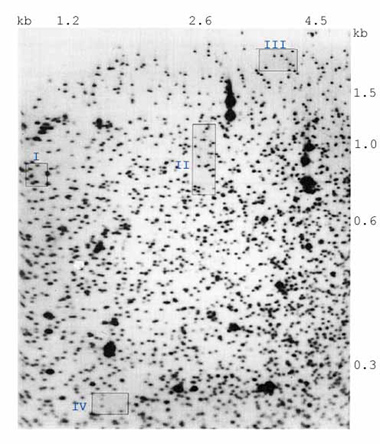
Figure 2. Digital image of the area of the autoradiogram analyzed.
The fragment sizes in each dimension are indicated. Based on published DNA sequences, the position of most of the intense spots matches the predicted position of ribosomal DNA fragments or Epstein-Barr virus fragments. The variants pictured here in the numbered blue boxes correspond to the quadrants of Figure 3.
For the quantitative studies of approximately 2000 spots on this image, 774 were selected as potential candidates because they were discrete, were not near the margins of the gel, and were not one of the large spots on the image. This analysis was limited to three mother/father/child trios run on two separate occasions. Of these 774 spots, 64 were singled out as “special” (the spot was judged to be a member of a genetic polymorphism) during preliminary matching. If spots that are the product of two homologous DNA fragments are to be distinguished with the requisite accuracy from spots that are the product of only one fragment, the coefficient of variation of spot intensity should be less than or equal to 0.12. At present, 439 of the spots in our preparations meet these standards. Particular attention will be directed at the current ability to distinguish between the autoradiographic intensity of a spot that is the product of two homologous DNA fragments as contrasted with the intensity of a fragment corresponding to one copy of the same DNA fragment. This is because in the usual case, a mutation will manifest itself as a spot of half-normal intensity in a child, both of whose parents have corresponding spots of normal intensity. This diminished spot intensity in the child may or may not be accompanied by the appearance of a new spot on the gel (Asakawa et al, Proceedings of National Academy of Science, USA 91:9052-6, 1994).
In the study of qualitative variation (ie, presence, absence, with no quantitative constraints), all of the autoradiograph was examined, including the 774 spots that were the basis for the quantitative studies. Besides the three family trios used in the quantitative study, three additional family trios were available for this study of qualitative variation, a total of six trios. In all, 392 fragments that varied in their occurrence among individuals were encountered. In no case did a fragment appear in a child’s pattern without the same fragment being observed in at least one of the parents. Of these 392 spots, 184 could be organized into 85 polymorphic systems in which all alleles were detected. The 85 recognized polymorphic systems can be organized into four categories based on the positions of the spots representing the alleles, relative to each other. Examples of polymorphisms of each of these types are shown in Figure 3. This figure also illustrates that differences in relative spot intensity between heterozygotes (each one copy) and homozygotes (two-copy spots) are readily detectable.
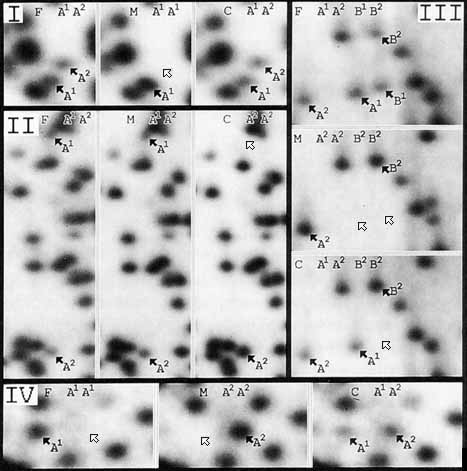
Figure 3. Types of polymorphisms observed.
Panels I through IV each show sections of 2-D DNA gels for family trios. Individuals are labeled as follows: F = father, M = mother, and C = child. Arrows point to variable spots. Black arrows indicate spots present in the pattern, and white arrows point to the location of absent spots. The inferred genotypes for each person are indicated.
Figure 4. Restriction map diagrams showing possible reasons for the various spatial configurations of the allelic pairs of spots.
Panels I through IV correspond with the panels of Figure 3. Fragments labeled C indicate the common allele with V1, V2, and V3 representing variants. Restriction sites are labeled as follows: N = NotI, H = HinfI, and E = EcoRV. Hatched rectangles labeled “del” represent deletions.
Figure 4 consists of diagrams of possible DNA variation leading to the location of the allelic fragments relative to each other on the gel for each type of polymorphism. Two additional fragments were always present in the patterns of fathers and the single male child in the study, but were absent in patterns of the five female children and of the mothers. In addition, these spots were approximately half the intensity of most others in the pattern so that it is possible that these fragments are from the Y chromosome. The remaining 206 variable fragments were members of polymorphic systems in which all of the allelic fragments for the system were not identified. It is likely that many of these spots represent an allele of a polymorphic system for which another allele produces a fragment outside the size separation range of the gel. Alternatively, some of these spots could be related to each other as alleles of a single polymorphism, but the relatedness has not been established because of marked differences in the migration between allelic fragments.
The 2-DE DNA separation system yielded remarkably reproducible 2-DE patterns. Numerous landmark invariant spots were present throughout the patterns for visual orientation, facilitating automatic spot matching and serving as size references for variable spots. The analysis of 2-DE patterns from six family trios revealed variability in the occurrence and intensity of a significant proportion of spots that appeared to be genetic in nature. The ability to visualize approximately 2000 fragments simultaneously, with variation in either separating dimension, undoubtedly increases the amount of information available relative to conventional 1-DE separations of genomic DNA fragments. These 2000 spots are derived from smaller, 1- to 5-kb, NotI-EcoRV fragments. We are now making an effort to develop a continuing 2-DE pattern for the bigger, 5- to 20-kb, NotI-EcoRV fragments that will visualize 2000 new spots. We believe that the power of this approach is augmented through the development of capabilities to characterize structural variants or mutants. Such studies, including development of a genomic DNA library, target cloning of DNA spots, and southern blotting of the 2-DE DNA gels are underway in collaboration with RERF research scientist M Kodaira.