-
Frequently Asked Questions about the Atomic-bomb Survivor Research Program
The following questions have been chosen from among many that RERF researchers are often asked about the study of long-term health effects in the survivors of the atomic bombings of Hiroshima and Nagasaki. We also have posted “Answers to frequently asked questions relating to the accident at the Fukushima Daiichi nuclear power plant” on our “Fukushima” page.
We welcome your questions and comments at Research Questions. Click here to see the RERF Glossary.
- Q1How many people died as a result of the atomic bombings?
-
A1
Deaths caused by the atomic bombings include those that occurred on the days of the bombings due to the overwhelming force and heat of the blasts as well as later deaths attributable to radiation exposure. The total number of deaths is not known precisely because military personnel records in each city were destroyed; entire families perished, leaving no one to report deaths; and unknown numbers of forced laborers were present in both cities. Recent estimates of total deaths occurring within two to four months after the bombings are shown in the Table.
Table. Estimated population size and number of acute (within two to four months) deaths in Hiroshima and Nagasaki after the atomic bombingsTable. Estimated population size and number of acute (within two to four months) deaths in Hiroshima and Nagasaki after the atomic bombings CityEstimated city population
at the time of the bombings
Estimated number of
acute deathsHiroshima
340,000-350,000 persons
90,000-166,000 personsNagasaki250,000-270,000 persons60,000-80,000 personsThe 1950 Japanese national census, carried out five years after the bombings, provided a rough estimate of the number of persons who were exposed and survived the bombings. Approximately 280,000 persons indicated that they had been “exposed” in Hiroshima or Nagasaki. (Although most of them were probably exposed in the former administrative districts of the cities, the census did not require recording the place of exposure.) The so-called “early entrants,” who entered the cities after the bombings, are not included.
- Q2How many cancers in atomic-bomb survivors are attributable to radiation?
-
A2
Table 1 summarizes the number of cancers (from 1950 to 2000 for leukemia deaths and from 1958 to 1998 for solid cancer occurrence) in the Life Span Study (LSS) A-bomb survivors in relation to radiation dose. The proportion of cancer deaths attributable to radiation exposure is considerably higher in those exposed closer to the hypocenters (as is the case with acute deaths from injuries and burns) (see also tables in “Solid cancer risks” and “Leukemia risks” in “Radiation Health Effects”). Overall, nearly half of leukemia deaths and about 10% of solid cancers are attributable to radiation exposure. If one assumes that LSS survivors represent about half of all survivors in the two cities, the total number of cancers attributable to radiation exposure through 2000 may be about 1,900 cases.
Table 1. Excess numbers of leukemia deaths and solid cancer occurrences in relation to dose
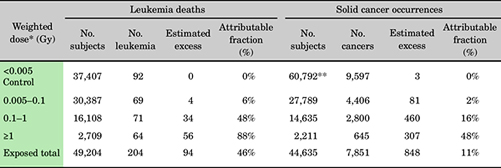
- *
- Weighted bone marrow dose (10 × neutron dose plus gamma-ray dose) for leukemia and weighted colon dose for solid cancers. For indication of the corresponding distance, please see Table 2.
- **
- These include not-in-city (NIC) group, which is not included in the leukemia data.
Table 2 presents the rough idea regarding the distance from the hypocenters and radiation dose.
Table 2. Mean weighted colon dose of LSS subjects and the corresponding distance from the hypocenter. (Since shielding conditions differ among the survivors, this radiation dose-distance relation does not apply to everyone.) Weighted colon dose Approximate distance from hypocenters Hiroshima Nagasaki 0.005 Gy2,500 m2,700 m0.05 Gy1,900 m2,050 m0.1 Gy1,700 m1,850 m0.5 Gy1,250 m1,450 m1 Gy1,100 m1,250 m - Q3What is the relationship of radiation to cancer occurrence?
-
A3
In addition to analyzing cancer mortality (deaths due to cancer), RERF analyzes data on cancer incidence obtained through the tumor registries of Hiroshima and Nagasaki prefectures.
Although mortality studies are valuable, the accuracy of cancer diagnoses from death certificates is limited and mortality studies provide little information about the occurrence of cancers with relatively high survival rates.
Among 105,427 members of the Life Span Study cohort whose radiation doses were known, 17,448 first primary solid cancers were diagnosed between 1958 and 1998, about three-quarters with histological verification. Significant radiation associations were observed for oral cavity, esophagus, stomach, colon, lung, breast, ovary, urinary bladder, thyroid, liver, non-melanoma skin, and nervous system cancers. Because factors other than radiation can increase the risk of cancer (such as smoking, certain chemicals, various viral and bacterial agents, and so on), RERF researchers are now examining individual types of cancer more carefully to determine what role radiation plays in the mechanism of cancer causation and how it might interact with these other cancer risk factors.
- Q4Are radiation-induced cancers still occurring among atomic-bomb survivors?
-
A4
Cancers attributable to radiation are still occurring among A-bomb survivors. The excess risk of leukemia, seen especially among those exposed as children, was highest during the first ten years after exposure, but has decreased over time and has now virtually disappeared. In contrast, excess risk for cancers other than leukemia (solid cancers) has stayed constant and seems likely to persist throughout the lifetime of the survivors.
- Q5What health effects other than cancer have been seen among the atomic-bomb survivors?
-
A5
The Life Span Study mortality analyses have revealed a statistically significant relationship between radiation and deaths resulting from causes other than cancer (see also “Deaths due to non-cancer disease” in “Radiation Health Effects”).
A total of 18,049 non-cancer deaths occurred between 1950 and 1997 among the 49,114 persons with significant radiation doses. The overall risk for non-cancer deaths is considerably smaller than that for cancer deaths, but because non-cancer causes comprise a larger fraction of human deaths overall, the total number of estimated radiation-related excess non-cancer deaths is about 50-100% of the number of estimated radiation-related cancer deaths (the reason for the wide range is that the data do not yet clarify the shape of the dose response, and different estimates of number of excess radiation-related cases result from various shapes of response that can be fit to the data).
Clinical researchers conducting the Adult Health Study of biennial clinical examinations have analyzed the relationship between radiation exposure and a number of selected non-malignant (non-cancer) disorders. Statistically significant excess risks were detected for uterine myoma, chronic hepatitis and liver cirrhosis, thyroid disease, and cardiovascular disease.
The results suggested that the thyroid gland in young persons may be more sensitive to radiation not only in the development of thyroid cancer, but also possibly in the development of non-malignant thyroid disorders.
Cataracts are another condition related to radiation. Symptoms can appear as early as one or two years following high-dose exposure and many years after exposure to lower doses.
Some non-cancer diseases may be associated with altered immune functions in A-bomb survivors. Immunological study of survivors demonstrated that the proportion of helper T cells was significantly decreased with increased radiation dose (see “Immunology Studies” of the Department of Radiobiology/Molecular Epidemiology).
Furthermore, the prevalence of myocardial infarction was significantly higher in individuals with a lower proportion of helper T cells. These results suggest that myocardial infarction in A-bomb survivors is partly due to defects of helper T cells. Such defects may contribute towards a reduced immune defense against microbial infections, possibly leading to atherosclerosis.
- Q6What health effects have been found among persons who were exposed before birth?
-
A6
Many health effects are associated with radiation exposure before birth. Effects noted among A-bomb survivors exposed in utero include a reduction in IQ with increased radiation dose, a higher incidence of mental disability in those heavily exposed, and impairment in physical growth and development. Many of these effects seem particularly pronounced in persons exposed between weeks 8 and 15 of gestation. Death rates and cancer incidence are being monitored for this group. Previous data suggested a dose-related increase in cancer risk similar to that seen in A-bomb survivors exposed as children, but more recent data indicate that the risk is lower in the survivors exposed in utero (see “Effects on the in utero exposed” in “Radiation Health Effects”).
- Q7What health effects have been seen among the children born to atomic-bomb survivors?
-
A7
One of the earliest concerns in the aftermath of the atomic bombings was how radiation might affect the children of survivors. Efforts to detect genetic effects began in the late 1940s and continue. Thus far, no evidence of increased genetic effects has been found. This does not necessarily mean that no effects exist because some past studies were limited in their ability to detect genetic damage.
Recent advances in molecular biology make it possible to evaluate genetic effects at the gene (DNA) level. RERF scientists are preserving blood samples that can be used for such studies.
Monitoring of deaths and cancer incidence in the children of survivors continues, and a clinical health survey was undertaken for the first time during 2002 to 2006 to evaluate potential effects of parental radiation exposure on late-onset lifestyle diseases. To date, there is no radiation-related excess of disease in adulthood, but it will require several more decades to fully determine this, as this population is still relatively young.
- Q8How many atomic-bomb survivors are included in the group being studied by RERF and how were they chosen for this study?
-
A8
To establish a population framework in which to conduct long-term follow-up of mortality and cancer incidence, about 94,000 people were selected from 280,000 A-bomb survivors who were resident in Hiroshima or Nagasaki at the time of the October 1950 Japanese national census. Of these, about 54,000 were exposed to significant radiation doses (Question 11) within about 2,500 meters from the hypocenters. Another 40,000 members of the study population were exposed beyond 2,500 meters and received very low doses.
In the 1950 Japanese national census, approximately 280,000 people indicated that they had been exposed to the atomic bombs. RERF’s study population probably includes about 50% of those proximally exposed (within about 2,500 meters of the hypocenters) and 25% of those distally exposed (greater than 2,500 meters from the hypocenters). These percentages are not precise because the census did not record the location of exposure in reference to the hypocenters.
An additional 27,000 who were not in Hiroshima or Nagasaki at the time of the bombs, but whose family registries were in Hiroshima or Nagasaki and who lived in either city at the time of the 1950 census also were included as an unexposed comparison group. These groups constitute the 120,000-member Life Span Study (LSS) cohort.
In addition to studying the LSS cohort, RERF scientists are involved in studies of several other populations: the Adult Health Study (AHS), in utero-exposed, and F1 cohorts. The AHS population comprises 23,000 members of the LSS, who, since 1958, have been asked to participate in biennial medical examinations carried out at RERF. The in utero-exposed cohort is a group of about 3,600 people who were exposed to the bomb while in the womb. The F1 population consists of about 77,000 people born in Hiroshima or Nagasaki between 1 May 1946 and the end of 1984 to parents with and without exposure to the bombs.
- Q9What percentage of the original atomic-bomb survivor study population is still alive?
-
A9
As of 2018, about 23% of the RERF study population was still living, and more than 71% of the survivors exposed under the age of 10 were still living.
As of 2018, the average age of the RERF study participants was 82.4 years.
- Q10How is information about the atomic-bomb survivors obtained?
-
A10
To make monitoring easier in long-term follow-up of mortality and cancer incidence due to radiation exposure, approximately 120,000 subjects were selected from residents of Hiroshima and Nagasaki identified through the national census in 1950, including 94,000 atomic-bomb survivors and 27,000 unexposed individuals, to comprise the Life Span Study (LSS) cohort.
Information about radiation effects in the atomic-bomb survivors is obtained in many ways, some utilizing the full LSS population, others based on subsets of that population.
-
- Mortality follow-up, checking for registrations of death and the cause of death.
- Checking registrations of cancer diagnoses made by local hospitals and physicians to the cancer registries in Hiroshima and Nagasaki Prefectures.
- Mail surveys asking about lifestyle and other factors have been sent approximately every 10 years to the LSS cohort members.
- A subset of LSS (the Adult Health Study) is examined clinically every two years. This clinically examined subset also forms the basis of cytogenetic, immunological, and molecular epidemiologic studies.
- Chromosome aberrations and blood proteins have been examined in a sample of approximately 16,000 and 23,000 children (respectively) born to one or two radiation-exposed parents to assess possible genetic damage passed on to children. Approximately 77,000 children were examined at birth and at age 9 months, between 1948 and 1954, for possible birth defects.
- The health status of children of atomic-bomb survivors is being examined based on mail surveys and clinical examinations. Questionnaires were sent to approximately 24,600 individuals over a period of four years starting in 2001, and clinical health examinations were conducted for about 12,000 people between 2002 and 2006 to evaluate potential effects of parental radiation exposure on late-onset lifestyle diseases.
-
- Q11What is “significant” radiation exposure?
-
A11
In the discussion of cancer risks presented here, attention is focused on survivors with estimated exposure doses greater than 0.005 Gy (5 mGy). No excess risks of cancer or other diseases have been seen among survivors with doses below 0.005 Gy.
A dose of 0.005 Gy is somewhat greater than the typical annual background radiation level to which people are exposed in normal daily life (0.001 to 0.003 Sv per year) and about one-fourth the currently accepted maximum annual dose allowed for radiation workers (0.02 Gy).
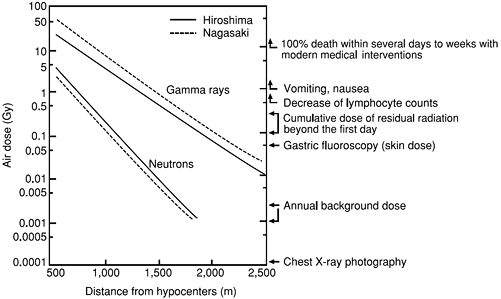
Survivors with doses of 0.005 Gy or more were typically within about 2,500 meters of the hypocenter in Hiroshima and 2,700 meters in Nagasaki. The average dose received by such survivors is about 0.2 Gy. The radiation dose decreased by half for every 200-meter increase in distance from the hypocenters.
Figure. Relationship between distance from hypocenters and radiation dose in air. If inside a typical house, the dose is reduced by 50% or more. Shown at the right are general biological symptoms and radiation doses from other sources.
- Q12Are Hiroshima and Nagasaki still radioactive?
-
A12
The practical answer is, “No.”
There are two ways residual radioactivity is produced from an atomic blast. The first is due to fallout of the fission products or the nuclear material itself–uranium or plutonium (uranium was used for the Hiroshima bomb whereas plutonium was used for the Nagasaki bomb)–that contaminate the ground. Similar ground contamination occurred as a consequence of the Chernobyl accident, but on a much larger scale (click here for more-detailed explanation). The second way residual radioactivity is produced is by neutron irradiation of soil or buildings (neutron activation), causing non-radioactive materials to become radioactive.
Fallout.
The Hiroshima and Nagasaki bombs exploded at altitudes of 600 meters and 503 meters, respectively, then formed huge fireballs that rose with the ascending air currents. About 10% of the nuclear material in the bombs underwent fission; the remaining 90% rose in the stratosphere with the fireball.
Subsequently, the material cooled down and some of it started to fall with rain (black rain) in the Hiroshima and Nagasaki areas, but probably most of the remaining uranium or plutonium was dispersed widely in the atmosphere. Because of the wind, the rain did not fall directly on the hypocenters but rather in the west region (Koi, Takasu area) of Hiroshima and the eastern region (Nishiyama area) of Nagasaki.
The maximum estimates of dose due to fallout are 0.006-0.02 Gy in Hiroshima and 0.12-0.24 Gy in Nagasaki.* The corresponding doses at the hypocenters are believed to be only about 1/6 of these values.
Nowadays, the radioactivity is so miniscule that it is difficult to distinguish from trace amounts (including plutonium) of radioactivity caused by worldwide fallout from atmospheric (as opposed to underground) atomic-bomb tests that were conducted around the world in past decades, particularly in the 1950s and 1960s.
- *
- These dose estimates were calculated on the basis of Roentgen exposure in air (1-3 R), the unit used originally to measure integrated external exposure to fallout radiation, multiplied by 0.87 to calculate rads in air (absorbed dose in air) and by 0.7 to arrive at rads in tissue (average absorbed dose to the tissue of the human body), divided by 100 to convert from rads to gray. More detailed information can be found in Chapter 6 (p. 224) of the Dosimetry System 1986 (DS86) “U.S.-Japan Joint Reassessment of Atomic Bomb Radiation Dosimetry in Hiroshima and Nagasaki Final Report,” published by the Radiation Effects Research Foundation. The DS86 publication is available at https://www.rerf.or.jp/library/scidata/scids/ds86/ds86a.html
Neutron activation.
Neutrons comprised 10% or less of the A-bomb radiation, whereas gamma rays comprised the majority of A-bomb radiation. Neutrons cause ordinary, non-radioactive materials to become radioactive, but gamma rays do not. The bombs were detonated far above ground, so neutron induction of radioactivity on the ground did not produce the degree of contamination people associate with nuclear test sites (Nevada test site in Southwest U.S., Maralinga test site in South Australia, Bikini and Mururoa Atolls, etc.).
Past investigations suggested that the maximum cumulative dose at the hypocenter from immediately after the bombing until today is 0.8 Gy in Hiroshima and 0.3-0.4 Gy in Nagasaki. When the distance is 0.5 km or 1.0 km from the hypocenter, the estimates are about 1/10 and 1/100 of the value at the hypocenter, respectively. The induced radioactivity decayed very quickly with time. In fact, nearly 80% of the above-mentioned doses were released within a day, about 10% between days 2 and 5, and the remaining 10% from day 6 afterward. Considering the extensive fires near the hypocenters that prevented people from entering until the following day, it seems unlikely that any person received over 20% of the above-mentioned dose, i.e., 0.16 Gy in Hiroshima and 0.06-0.08 Gy in Nagasaki.
There was severe ground contamination after the Chernobyl accident. Why wasn’t it so serious after the Hiroshima and Nagasaki bombings?
Background
Release of radioactive materials after the Chernobyl reactor accident
Basic information
The Chernobyl reactor contained about 180 tons of nuclear fuel consisting of two percent, or 3,600 kg, total uranium. The amount of nuclear fuel released is estimated at seven tons (corresponding to 200 kg of uranium). Fission products increase the longer the fuel is used.
The Hiroshima bomb contained around 64 kg of uranium, and about 1.56% (or 1 kg) underwent nuclear fission.
In a nuclear reactor, when the nuclear bed melts, volatile radioactive materials are released extensively. It is estimated that 100% of the rare gases, about 50-60% of the iodine, and about 20-40% of the cesium contained in the reactor are released.
- The total nuclear fuel in the Chernobyl reactor was 180 tons (corresponding to 3,600 kg of Uranium-235), more than 100 times greater than that of the Hiroshima bomb (total weight of the bomb was about four tons, but Uranium-235 is estimated at around 64 kg).
- In the case of the Chernobyl accident, the nuclear fuel melted and volatile radioisotopes were released in large quantities. For example, as stated, 100% of the rare gases, 50-60% of iodine, and 20-40% of cesium were released. Thus, although the total nuclear fuel released is estimated at a few percent (7-10 tons), the release of other radioactive materials was quite extensive, in disproportion to the amount of nuclear fuel released.
- It is estimated that about 1.56% (or 1 kg) of the uranium of the Hiroshima bomb underwent nuclear fission. The bomb exploded in the air and formed a large fireball that subsequently ascended to reach the stratosphere. Part of it fell to the ground in black rain while the remainder was widely dispersed.
- Q13With regard to Figure 12 on page 22 of RERF’s “A Brief Description,” the corresponding text on page 21 states that effects of A-bomb radiation exposure were observed for benign uterine tumors, thyroid disease, chronic liver disease, cataract, and hypertension. For diseases other than those mentioned above, what does the figure suggest?
-
A13
With regard to the other diseases listed in Figure 12, it cannot be said that their frequencies increased in relation to radiation exposure in terms of the analysis shown in the original paper that contained the figure.
The black dots shown in Figure 12 represent relative risk per Gy. Furthermore, you can see horizontal lines that pass through these dots. The horizontal lines indicate 95% confidence intervals for relative risk, i.e., the reliability of relative risk. If a horizontal line is located on the right side of the dotted vertical line in excess of 1.0 (high risk zone), the value that represents absence of risk, it can be interpreted that risk is significantly high from a statistical viewpoint. If the line straddles the 1.0 line, however, it cannot be said that radiation risk is significant, because the possibility also exists that disease frequency may decrease statistically within the confidence interval depending on radiation dose.
For the reasons mentioned above, the horizontal lines (relative risk) for the other diseases of interest straddle that 1.0 point, and hence it cannot be said that the risks are statistically significant.
References