Cholesterol Levels in the Adult Health Study, 1958-1986
Similar age cohorts studied across several generations appear to exhibit worsening trends in total serum-cholesterol levels, a possible factor in the apparent increased mortality from coronary heart disease among female atomic-bomb survivors.
by Michiko Yamada, Department of Clinical Studies, RERF
This article was originally published in RERF Update 5(4):5-6, 1993.
The long-term follow-up of the Adult Health Study (AHS) cohort of atomic-bomb survivors offers a vast amount of information for epidemiologic research, including biennial measurements of total serum cholesterol (TC) collected since 1958 for about 10,000 persons, ranging from adolescents to the elderly. These data provide an invaluable opportunity to elucidate not only the longitudinal changes in TC levels in a Japanese cohort over 30 years but also the relationship between exposure to ionizing radiation and TC.
Subjects and methods
The study sample comprised 9633 subjects, including 3437 males (Hiroshima: 2416; Nagasaki: 1021) and 6196 females (Hiroshima: 4602; Nagasaki: 1594) who had participated in at least one clinical examination between 1958 and 1986. The radiation-exposed group included 5514 persons for whom radiation dose estimates were greater than zero, and the unexposed group included 4119 persons with dose estimates of zero. Subjects diagnosed with medical conditions that might affect TC levels were not included.
Modeling and parameter estimating were carried out using the mixed-effects model of Laird and Ware (Biometrics 38:963-74, 1982), which includes the growth curves as a special case. The objectives of the growth-curve method are to characterize the temporal pattern of change in the serial measurements obtained longitudinally and to examine factors that may cause changes in this pattern. This method is identical to the usual regression technique except that for a specific individual, rather than across several individuals, the serial observations are assumed to be normally distributed with a mean and variance and somehow related to certain independent (growth-related) variables such as age, height, and weight. The nonindependence of the serial measurements for an individual is also considered. For the i th individual, denote the dependent variable as
![]()
to represent the measurements obtained from the ji AHS examinations participated in by person i, where yi is the set of values of (natural log of) TC. We assume that the growth model of yij in person i is related to his/her age and body mass index (BMI), where BMI = (weight ÷ height2) × 100. That is,
![]()
Each individual is associated with his/her own growth model, equation (1), and his/her own set of growth parameters, β=(β0i,…,β5i ). However, he/she may also be considered a random observation from a population consisting of similar individuals and possessing its own growth curve and parameters, β=(β0,…,β5). This is called the random-effects model for the analysis of longitudinal data under the growth-curve setting. One of the goals of growth-curve analysis is to identify factors that distinguish the subpopulation, that is, factors that alter the growth parameters and thus the overall shape of the growth curve. This analysis examines the following factors–city, sex, year of birth minus 1945 (YOB*), and Dosimetry System 1986 (DS86) radiation dose–and their interactions, which may affect the population growth curve by modifying the values of beta.
Results
The parameters in the estimated growth curve of ln(TC) include city, sex, YOB*, city × sex, city × YOB*, sex × YOB*, city × sex × YOB*, and dose × sex as fixed effects. That is, all coefficients of dose not including sex are zero, indicating that radiation effects are apparent only in females. In the first step, to present the temporal trends of TC apart from radiation effects, we adjust for dose by substituting zero for dose in the growth curve of TC. To calculate the expected values of ln(TC), the predicted values of BMI from the BMI growth function were used.
The model is difficult to interpret because of its many interaction terms, so it is not shown in detail here. It can be said, at least, that variations in the TC levels with age are modified by gender, place of residence, and year of birth. More detailed descriptions of the differences require graphical presentation.
Effects of sex and birth year on the TC growth curves
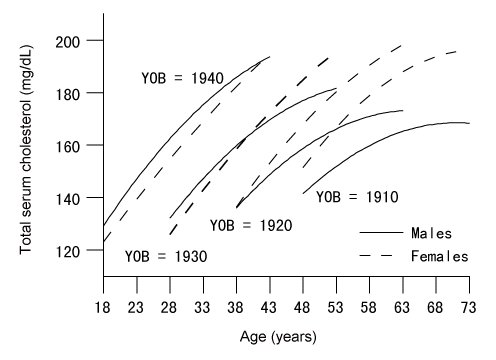
Figure 1 shows the predicted TC levels for Hiroshima men and women born in 1910, 1920, 1930, and 1940. TC levels increased with age. The greatest change occurred in younger female subjects, for whom the average increase over the 28 years was about 70 mg/dL, whereas the smallest change occurred in older males, for whom the average increase during the same period was slightly more than 20 mg/dL. The changes experienced by the Nagasaki subjects were somewhat smaller. For both cities, the rate of increase in TC levels declined gradually with age in males, whereas the rate remained virtually constant in females until age 60 years. Differences in the TC levels based on sex were small under age 40 years but increased with aging.

Figure 1. Cholesterol growth curves in Hiroshima males and females. Predicted curves for persons with Dosimetry System 1986 estimates of zero. Predicted body-mass-index growth curve was used. YOB = year of birth.
TC levels at a given age were higher for those born later. The cohort effect, represented by 10-year intervals, was greater for those born later (for example, in 1930 and 1940), with an average difference of more than 20 mg/dL. However, the average difference for those born earlier (for example, in 1910 and 1920) was about 10 mg/dL. The effects of these 10-year intervals in birth cohort on the TC levels appeared to be similar in men and women.
Effects of place of residence on the TC growth curves
TC levels were consistently higher for residents of Hiroshima than for residents of Nagasaki (both men and women). Effects of birth cohort and sex on the TC growth curves were similar in the two cities.
Effects of varying BMI on the TC growth curves
BMI had a general tendency to increase with age in both men and women, up to about age 60 years in men and up to the mid-60s in women, followed by a decrease with further aging.
The general effect of the BMI is to elevate TC levels, but only a small part of the changes in TC could be explained by changes in the BMI during the study period.
Effects of radiation
As mentioned earlier, radiation effects are apparent only in females. To examine this radiation effect, we estimated a parsimonious model of the TC growth curve by using only the data on women (n = 6198). In this parsimonious model, radiation effects were highly significant ( = 42.80, p < .00001). Next, we examined whether radiation effects varied for women of different ages by including the interaction of dose with YOB*. The test of zero simultaneous effect was nonsignificant (
 = 4.07, p = .67), indicating that age at exposure does not alter the radiation effect.
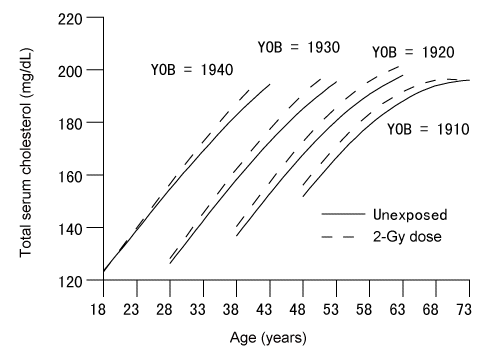
Figure 2 shows the predicted TC growth curves for women born in Hiroshima during 1910, 1920, 1930, and 1940 for whom DS86 dose estimates were 0 Gy or 2 Gy. TC levels in the exposed women were higher than in the non-exposed, with the difference increasing slightly with age but attenuating past the age of 65. The maximum difference at 1 Gy, occurring at around age 48 years, is only about 2 mg/dL. The 95% confidence bounds for the TC level at age 48 with a BMI of 0.203 for the non-exposed Hiroshima women born in 1930 are 184 mg/dL and 187 mg/dL, with a point estimate of 185 mg/dL. The corresponding values for women exposed to 1 Gy are 186 mg/dL and 189 mg/dL, with a point estimate of 187 mg/dL. Although the shapes of the growth curves for 0-Gy and 2-Gy exposures appear to differ by year of birth, this is due to variation in ages at which TC levels were measured for the various birth cohorts and not due to differences in radiation effects.

Figure 2. Total serum-cholesterol growth curves in Hiroshima females, by radiation exposure. YOB = year of birth. Body mass index predicted for the appropriate radiation level used.
Discussion
This study is one of the few long-term investigations of such a large Asian population. The observed increase in TC experienced by AHS cohort members of comparable ages across generations was more dramatic than in most longitudinal studies conducted on non-Asian, for example, North American, populations. The rapid increase of and strong cohort effect on TC suggest that the effects of factors related to behavior, life style, and environment that vary across generations and that are responsible for worsening of the TC profile have grown stronger with time.
Although detailed information on nutrition was not available for our study, clearly Japanese dietary habits are undergoing rapid “westernization,” especially in urban areas. (Results of an AHS mail survey conducted from 1983-85 indicate that fat intake is greater in Hiroshima than in Nagasaki, which might explain the intercity variation in TC.)
A plausible explanation for the difference in radiation effects among the women in this study is that menopause occurs earlier in women exposed to radiation, which, in turn, accelerates the elevation of TC levels. (For a report on the early onset of menopause among Nagasaki women, see M Soda and J Cologne, RERF Update 5[2]:3, 1993.)
Our current finding suggests that the elevated TC level associated with radiation exposure contributes to increased mortality from coronary heart disease among radiation-exposed women (see K Kodama, RERF Update 5(4):3-4, 1993; Y Shimizu et al, RERF Technical Report 2-91 and Radiation Research 130:249-66, 1992).

