A Quick Look at Life Span Study Report 12, Part I
The latest review of cancer mortality among the atomic-bomb survivors employed improved analytical methods to clarify the age-time patterns of excess cancer risk.
by Donald Pierce, Yukiko Shimizu, and Kiyohiko Mabuchi, RERF Department of Epidemiology, and Dale Preston, RERF Department of Statistics
This article was originally published in RERF Update 8(1):10-2, 1996.
The Life Span Study (LSS) report on cancer mortality through 1990 was published in the July issue of Radiation Research. This latest report extends the previous LSS report by including 5 more years of follow-up, along with the addition of about 10,000 subjects recently assigned computed dose estimates. Some highlights of the report follow.
Tables 1 and 2 provide an overview of the excess cancer mortality. All analyses in the LSS report use doses in sievert based on a neutron relative biological effectiveness of 10. The expected background refers to estimated numbers of cancer deaths that would be expected for this cohort between 1950 and 1990 had there been no radiation exposure. The estimated excess is the difference between the observed numbers and this expected background; this is a random quantity, and the negative values seen in some low-dose categories are within normal sampling variation for an excess risk of zero. Although the excess relative risk depends on age at exposure and sex, these tables give a rough idea of the levels of risk by dose categories. The mean colon and marrow doses for those in the cohort with significant exposures was about 0.2 Sv. We estimate that within our follow-up, there have been about 334 excess deaths from solid cancers and about 87 from leukemia. We note that according to imprecise assessments the cohort considered here may contain about half of all survivors with significant radiation exposures.
|
|||||||||||||||||||||||||||||||||||||||||||||||||||||||||||||||||||||||||||||||||
|
|
|||||||||||||||||||||||||||||||||||||||||||||||||||||||||||||||||||||||||||||||||
|
|||||||||||||||||||||||||||||||||||||||||||||||||||||||||||||||||||||||||||||||||
Note that in contrast to leukemia, about 25% of the excess solid cancer deaths occurred in the last 5 years; for those exposed as children, this figure is nearly 50%. That excess solid cancer risks persist for so long–most likely throughout lifetime even for those exposed as children–has been one of the most important findings of the RERF cancer studies. This was generally unanticipated, and the evidence for such prolonged risks only gradually emerged during the past 2 decades. A primary emphasis of the report is to take advantage of the continued follow-up and improved analytical methods to clarify the age-time patterns of excess cancer risks.
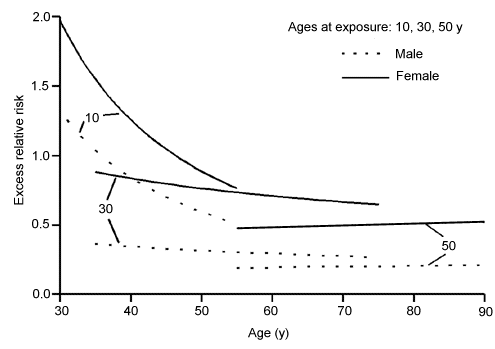
Figure 1 portrays the age-specific excess relative risk (ERR) per sievert, ie, the ratio of excess to background age-specific mortality rates. These are given for each sex and for ages at exposure 10, 30, and 50 years. The ERR for females is larger than for males because the excess absolute rates (EAR) for cancer death are similar for the sexes, whereas the females have much smaller background rates. For those exposed at ages 30 and 50 years, the ERR for each sex has been fairly constant over the follow-up, but at levels that depend on age at exposure. That is, for those exposed as adults, the EAR has increased with age rather proportionately to the age increase in background rates. For those exposed as children, the ERR was initially quite high, but has decreased during follow-up. The large ERR at young ages is the result of dividing a fairly small EAR by a quite small background rate. The declining ERR means that the age-time increase in the EAR has been less rapid than the age increase of the background rates. The extent of this decrease–in particular, the level of ERR early in the follow-up–is imprecisely estimated, and, in fact, the statistical significance of a decrease is marginal.
In this report, increased emphasis has been placed on description of the age-time-sex patterns in the EAR. Although for some time, the primary numerical risk estimates have been for the ERR, and we continue this by giving ERR estimates specific to sex and age at exposure, we have found that a clearer understanding of the data results from giving increased attention to the EAR.
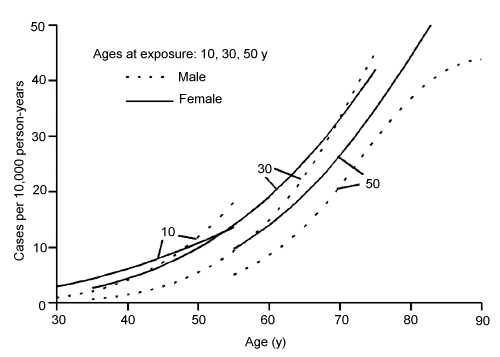
Figure 2 portrays the EARs resulting from multiplication of the ERRs of Figure 1 by age- and sex-specific background rates. The sex differences seen in this plot are not statistically significant, and the age-at-exposure differences only marginally so. This provides a clearer indication of the excess rate for those exposed as children, which is seen to be rather small during the current follow-up as compared to those exposed as adults and to increase with age or time. It is commonly said, based essentially on what is seen in Figure 1, that children are more sensitive to radiation than adults. Although it is true that they have had larger ERRs during much of the follow-up, the patterns seen in Figure 2 should be considered in evaluating such statements.
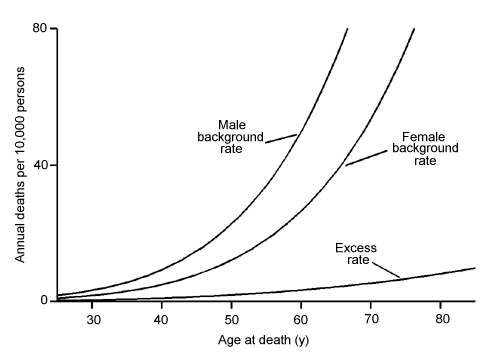
A single curve passing through these EAR patterns, illustrated in Figure 3, provides an adequate description of the data. That is, to a useful approximation, the age-specific excess absolute cancer death rates are the same for both sexes and do not depend on age at exposure. Following a minimal latent period of 5-10 years, an individual’s excess risk can be thought of as depending only on his or her current age. If one fits a single curve through these patterns and divides this EAR by the age- and sex-specific background rates, the result is a single curve for each sex which corresponds closely to the three line segments shown in Figure 1. Thus, one may also think of the ERR for each sex as depending only on age, rather than on age at exposure.

Figure 1. Excess relative risk per sievert for solid cancer as a function of age for atomic-bomb survivors exposed at 10, 30, or 50 years of age.

Figure 2. Excess absolute solid cancer rate per sievert as a function of age for atomic-bomb survivors exposed at 10, 30 and 50 years of age.

Figure 3. Background and excess solid cancer rates as a function of age for a survivor exposed at age 30 to a radiation dose of 0.20 sievert–the mean dose for survivors considered to have received a significant exposure.
The age-time patterns of excess risk for leukemia are complicated, but as has been clear for some time the significant leukemia risks occurred much earlier in the follow-up, with substantial risk even before 1950.
These age-time patterns of excess risk are potentially important in understanding the biological mechanisms of radiation-related cancer, and they also provide a basis for projecting lifetime risks for the cohort. Tables 3 and 4 give estimated lifetime risks by sex and age at exposure. Projection beyond the current follow-up is mainly an issue only for solid cancers in the case of those exposed as children. In LSS Report 12, four methods were used for such projections, but only an intermediate one is given here. The sex differences seen for solid cancers reflect largely that females live longer. The larger solid cancer risk for those exposed as children is substantially due to their having elevated risk for a greater portion of their lives. Because the leukemia dose response is somewhat nonlinear, excess lifetime risk estimates for it at low doses, say 0.1 Sv, are about 50% of that predicted by simple linear extrapolation.
|
||||||||||||||||||||||
|
|
|
||||||||||||||||||||||
Finally, here and in LSS Report 12, there is substantial emphasis on describing excess risk at a dose of 1 Sv. Among those in our cohort with significant exposures, the mean dose is about 0.20 Sv. Figure 3 places in clearer perspective the excess cancer mortality risks for atomic-bomb survivors, in general, by presenting excess risks at 0.20 Sv. For this, we have used the simple EAR description which was discussed above. For perspective, we present the age-sex-specific background rates for those age 30 years at exposure. We emphasize, however, that the EAR shown in Figure 3 is applicable to all ages at exposure, beginning after some minimal latent period of about 10 years following exposure.

