Noncancer Mortality in the Life Span Study, 1950-1985
Among Life Span Study deaths for the period 1950-1985, the authors find evidence of an excess risk of noncancer mortality in the high dose range.
by Yukiko Shimizu, RERF Department of Epidemiology, Hiroshima; Hiroo Kato, National Institute for Minamata Disease; William J Schull, RERF Permanent Director; and David G Hoel, National Institute of Environmental Health Sciences, Research Triangle Park, NC
This article was originally published in RERF Update 3(2):3-4, 1991.
Since 1950, the Atomic Bomb Casualty Commission (ABCC) and its successor, the Radiation Effects Research Foundation (RERF), have studied a fixed cohort of A-bomb survivors and suitable comparison subjects, the so-called Life Span Study (LSS) sample, to ascertain the effects of A-bomb radiation on mortality. Periodic analyses of the results of this surveillance continue.
Recently, mortality in the Life Span Study sample has been determined for 1950-1985, and an analysis of cancer deaths using the revised DS86 doses has been reported (Shimizu et al., RERF TR 12-87 and RERF TR 5-88). The evidence of radiation-related increases in site-specific malignancies continues to emerge. However, it has not been clear heretofore whether mortality from causes other than cancer is also increased and whether a life-shortening occurs attributable to these other causes of death. Previous analyses of noncancer mortality (see Kato et al., RERF TR 5-81 for the most recent) have failed to reveal evidence of either of these possibilities. However, it was noted that mortality from causes other than cancer appeared to be elevated in the highest T65 exposure group, greater than or equal to 4 Gy. With the accumulation of seven more years of follow-up beyond the last analysis and using the new dosimetry, we find stronger evidence of an excess risk from noncancer mortality in the high dose range, i.e., 2 Gy or higher (Shimizu et al., RERF TR 2-91, in press). This evidence will be briefly presented here.
Among a total of 120,128 LSS sample subjects (exposed: 93,611; control: 26,517), DS86 dose estimates are available on a total of 75,991 individuals who are referred to as the DS86 subcohort. Among a total of 28,737 deaths occurring in the period 1950-1985 in this subcohort, for 75 the cause was unknown; for 1,515, death was due to external causes; for 6,224, it was attributed to neoplasm; and 146 deaths were from blood disease. The remaining 20,777 deaths from “all diseases except neoplasm and blood disease” are considered in the present analysis (see table). The accuracy of the diagnosis of death due to blood disease is very low, and such deaths often include leukemia and malignant lymphoma. Thus, we have excluded blood disease from the analysis, and the term “noncancer” will refer to all diseases except neoplasm and blood disease. The table shows the number of noncancer deaths by specific cause. About half of these deaths were ascribed to circulatory disease.
| Cause of death | No. of deaths | ||||||||||||||||
|
|||||||||||||||||
|
|||||||||||||||||
|
|||||||||||||||||
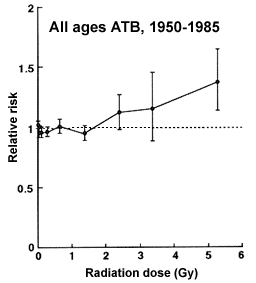
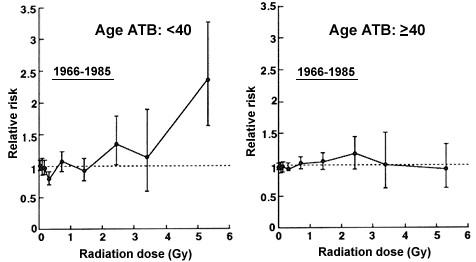
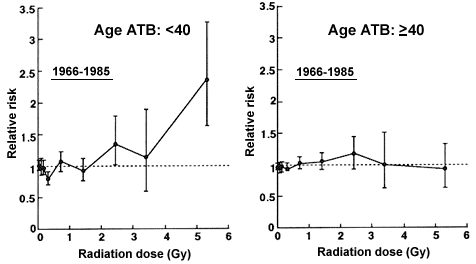
Noncancer mortality in the period 1950-1985 exhibits a significant nonlinear dose response with excess risks apparent at doses of 2 or 3 Gy and over (Figure 1). Statistically, a pure quadratic or a linear-threshold model (the estimated threshold dose is 1.4 Gy and its confidence limits are 0.6-2.8 Gy) is found to fit better than a simple linear model. Generally, this increase in noncancer mortality is statistically demonstrable after 1966 and among the younger survivors ATB (<40), suggesting a sensitivity for this age group. For specific causes of death, an excess in relative risk at the high dose level, i.e., 2 Gy or more, is seen in circulatory (both stroke and heart disease) and digestive diseases (particularly liver cirrhosis) among the younger age ATB group (<40) in the recent period (1966-1985). The findings on circulatory disease are supported by a cardiovascular disease (CVD) incidence study based on specific diagnostic criteria, autopsy materials, and death certificates, as well as clinical findings including ECG results.


Figure 1. Dose-response curve of mortality from all diseases except neoplasm and blood disease. The best-fitting dose-response model for the whole period is a quadratic or linear-threshold model. The excess deaths observed stem largely from deaths among those who were younger at the time of the bombing (ATB) and in the recent period. In the early years, a U-shaped dose response (a downward slope at the low doses and an upward slope at the high doses) is seen for those who were older ATB. (Bars indicate 90% confidence interval of relative risk.)
The increased risk for noncancer mortality is much less than that for cancer. For all subjects, relative risks at 2 Gy are 1.06 for noncancer deaths (based on a linear-threshold model) and 1.78 for cancer deaths (based on a linear model). Excess deaths per 104person-year-gray (PYGy) are 1.2 for noncancer and 10.0 for cancer. For those survivors less than age 40 ATB who died in the years 1966-1985, the relative risks at 2 Gy are 1.19 for noncancer deaths and 2.06 for cancer deaths, and the excess deaths per 104 PYGy are 1.7 and 11.2, respectively.
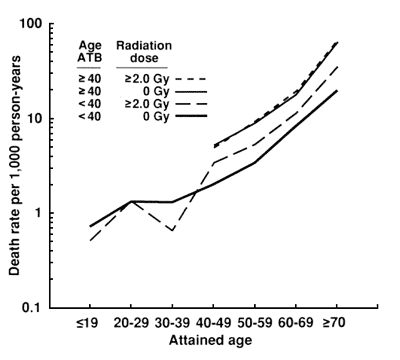
The Gompertz function, which is the logarithm of the age-specific death rate, has been shown to describe adequately the mortality rate of most chronic diseases in the adult. The logarithm of the age-specific death rates yields a straight line, and life-shortening is suggested by an elevation of the Gompertz function. Figure 2 shows the logarithm of the age-specific death rates for noncancer in the survivors exposed to 2 Gy or more as contrasted with the comparison (0 Gy) group for those survivors exposed under age 40 ATB and for those exposed at ages ATB greater than or equal to 40. In the former instance, the age-specific death rate from noncancer is elevated in the greater than or equal to 2.0 Gy group as compared with that in the 0 Gy group. But for ages ATB greater than or equal to 40, no elevation in the Gompertz curve is observed.

Figure 2. Age-specific death rate (per 1,000 person-years) by radiation dose and age ATB for all diseases except neoplasm and blood disease.
It is not unreasonable to assume that the effects of radiation on cancer induction (presumably stochastic phenomena) and on noncancer mortality differ, and that the latter may follow a nonstochastic process with a threshold dose. However, given the recent evidence of a transforming gene in the atheromatous plaque, the increase in CVD is a particularly intriguing finding and may suggest, if the association is real, that the effect of ionizing radiation on atherosclerosis should be treated as a stochastic phenomenon. Further data will be especially interesting in this regard.
The findings presented here, based as they are on death certificates, have their limitations. Most significant perhaps is the possible erroneous attribution of radiation-related cancer deaths to other causes. To examine the impact of such errors on the observed increased relative risk of noncancer mortality, we have used the information on classification errors revealed by the autopsy and tumor registry data that are available as well as the clinical data provided by the Adult Health Study. At present, the contribution such errors may make to the apparent increase in noncancer deaths at the higher doses cannot be estimated as rigorously as is obviously desirable. However, even now, this increase does not appear to be fully explicable in terms of classificatory errors. A formal statistical analysis of the effects of misclassification, using autopsy data, also leads to the conclusion that the observed significant dose response in noncancer mortality cannot be easily explained by misclassification of cancer (Sposto et al., RERF TR 4-91; see also RERF Update 3(2):5, 1991).
Some evidence is found to support the selection effect hypothesized by A. Stewart and G. Kneale (Health Phys 58: 729-35, 1990). However, this evidence is limited to only the older ages ATB in the initial years of study. A U-shaped dose response (a downward slope in the low doses and an upward slope in the high doses) is seen for noncancer mortality among survivors whose age ATB was 40 or older and who died in 1950-1965 (Figure 1). Since radiation-induced cancers (except leukemia) are observed primarily in the later period, the selection cannot affect the cancer risk appreciably.
Further follow-up of mortality in this LSS cohort, as well as disease revealed by the biennial physical examinations of the morbidity subsample (the Adult Health Study), will be needed to confirm this suggestion of a radiation-related increase in mortality from causes other than cancer and to determine whether it results in a demonstrable life-shortening among the heavily exposed A-bomb survivors.

