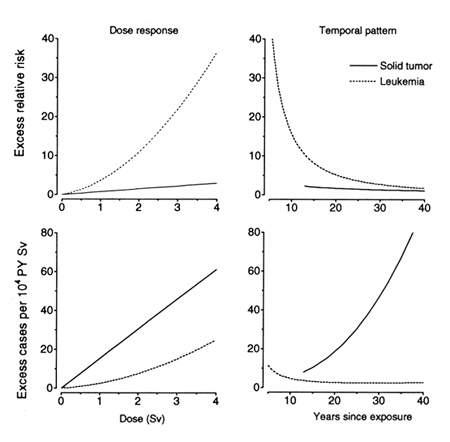
Solid Tumor and Leukemia Relative Risk
This article was originally published in RERF Update 3(4):14, 1991.
These figures compare the dose response and temporal patterns for the excess risk of solid tumor and leukemia incidence (all types combined) in the RERF Life Span Study. Risks are plotted for a 25-year-old Hiroshima male. The left-hand column shows the fitted dose response 20 years after exposure. The right-hand column shows the temporal pattern following an exposure to 1 Sv.
The plotted curves are based on parametric excess relative risk (ERR) models fit to the incidence data. The solid tumor data cover the 1958-87 period. The ERR model is linear in dose and includes sex, age at exposure, and time since exposure effects. The leukemia data cover the period from 1950-87. The ERR is modeled as a time-dependent quadratic function of dose with sex and age at exposure effects. A constant RBE of 10 was assumed in both models.
Although these plots do not provide a complete picture of the nature of the excess cancer risk in the LSS, they do indicate the marked contrast in the patterns of leukemia and solid tumor risks, and they highlight the importance of considering both relative and absolute risks in discussions of radiation effects.


