
DS86 Gamma and Neutron Colon Dose Estimates for LSS Survivors by Distance
by Dale L Preston, Department of Statistics
This article was originally published in RERF Update 9(1):8, 1998.
Most analyses at RERF are made in terms of DS86 dose estimates without explicit consideration of distance. However, the relationship between dose and distance is important in consideration of various issues. Distance from the hypocenter is the primary determinant of dose, with external and self-shielding having important but secondary roles. This note and the figures presented below describe the relationship between DS86 dose estimates and the distance for survivors in the LSS cohort.
The final report (Roesch 1987) completed at the time of the introduction of the DS86 system included tables (p.131) and figures (p. 133) comparing DS86 and T65D free-in-air gamma and neutron kerma estimates by city. Part 1 of LSS Report 11 (Shimizu et al. 1990) included plots of shielded gamma and neutron kerma versus distance estimates for survivors in the two cities. These plots, especially those in Report 11, provide useful summaries of aspects of the DS86 doses, but they have some limitations. In particular, there have been no published tables presenting the data used for the shielded kerma plots and no plots or tabulated data describing the organ-dose versus distance comparisons. In addition, since publication of early reports, the DS86 system has been extended to include additionally proximally exposed survivors, primarily Nagasaki factory workers.
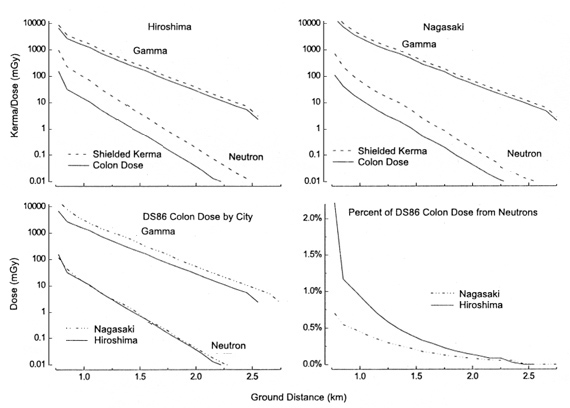
The figures below display the average gamma and neutron components of shielded kerma and colon dose for LSS survivors within 2,600 meters of the hypocenter in Hiroshima and 2,800 meters in Nagasaki. (Total kerma estimates for survivors at greater distances are estimated to be less than 0.001 mGy.) The data plotted are averages for survivors in 100-meter (ground) distance categories. The top two panels compare kerma and colon-dose estimates for the two cities. As these plots indicate, neutron doses are reduced to a greater extent than gamma doses by passage through the body. The lower left panel presents a direct comparison of gamma and neutron colon-dose estimates versus distance in the two cities. It can be seen that at a given distance, gamma doses in Nagasaki are greater than those in Hiroshima while neutron doses are quite similar. The lower right panel shows the percentage of total colon dose that arises from neutrons as a function of distance for the two cities. It is noteworthy that for Hiroshima at distances beyond 1.5 kilometers, at which there are uncertainties about DS86 neutron-dose estimates, neutrons account for less than 0.4% of the total dose.
A table with the data from which these plots were made (including bone marrow doses as well) is available HERE.
References about this subject
References about this subject