
Extrapolating Life Span Study Cancer Risk Estimates to Low-dose Radiation Exposures
The shape of the cancer incidence dose-response curve for the atomic-bomb survivors provides important information for extrapolation of risk estimates from high-dose studies to low doses of exposure.
The shape of the cancer incidence dose-response curve for the atomic-bomb survivors provides important information for extrapolation of risk estimates from high-dose studies to low doses of exposure.
This article was originally published in RERF Update 4(3):5-6, 1992.
Few large-scale epidemiological studies are available for directly evaluating the excess risk of cancer after exposure to low doses of radiation. Extrapolation from high-dose studies is therefore an important alternative method when assessing the low-dose risks. Results of this approach are, however, highly dependent on the shape of the dose-response curve predicted by the extrapolation model.
A detailed study of the shape of the cancer mortality dose-response curve using the RERF Life Span Study (LSS) mortality data recently has been published (DA Pierce and M Væth, Radiation Research 126:36-42, 1991). Within the context of linear-quadratic dose-response models, the maximum curvature consistent with the LSS mortality data was assessed. The extent of curvature was expressed by a low-dose extrapolation factor (LDEF). This factor gives the value by which linear risk estimates should be divided to arrive at appropriate estimates of risk at low doses and high-dose rates. The analysis indicated that LDEF values greater than 2.0-2.5 are moderately inconsistent with the LSS cancer mortality data.
In studies of the cancer risks associated with ionizing radiation, cancer incidence data are, in general, preferred to cancer mortality data. Within the last 10 years, much has been done to establish uniform diagnostic criteria and complete case ascertainment within the LSS cohort. As a result, a comprehensive analysis of the cancer incidence for a large number of organs has just been completed (D Thompson et al, RERF TR 5-92). At the recent conference on low-dose irradiation and biological defense mechanisms held in Kyoto, 12-16 July 1992, we presented some preliminary results on the curvature of the cancer incidence dose-response function. Here we shall briefly summarize these results. The methodological approach used for these analyses is essentially identical to the one used in the previous analysis of the cancer mortality data. Therefore, it is easy to compare the two sets of results.
Incidence of solid tumors and leukemia
The cancer incidence dose-response function was studied for two groups of cancers: solid tumors combined and leukemia. For both, the analysis was restricted to survivors with DS86 kerma estimates ranging between 0 Gy and 4 Gy. For solid tumors, the analysis included 79,972 survivors followed during the period 1958-87. A total of 8613 solid tumors had been registered in this period. For leukemia, the follow-up started in 1950, and 231 cases were observed among the 86,325 survivors included in this analysis. For each group of cancers, the incidence data were analyzed in cross-tabulated form using the Poisson regression method that has become the standard approach for analyses of mortality and incidence in the LSS cohort. Because the shape of the dose-response curve is sensitive to random errors in the dose estimates, the complete analysis was carried out both using dose estimates as given by the DS86 dosimetry and using estimates adjusted for the effect of random errors in the dosimetry according to the approach recently developed at RERF (DA Pierce et al, Radiation Research 123:275-284, 1990).
The risk estimates as a function of dose depend in a complicated manner on the sex, age at exposure, and attained age of the survivor. However, the distribution of survivors according to age at exposure and sex does not differ much between dose categories, so the excess relative risk as a function of dose derived from the crude rates will, to a first approximation, describe the excess risk for a survivor at the average age of the cancer occurrence. Figure 1 shows such plots for the two groups of cancers. The best fitting linear-quadratic model and the 95% confidence intervals are also indicated on the plots. The dose response appears linear for the solid tumors, whereas substantial curvature is seen in the dose-response curve based on leukemia incidence.
Figure 1. Excess relative risk estimates for solid tumor incidence (upper panel) and leukemia incidence (lower panel) with 95% confidence intervals
Low-dose extrapolation factors based on incidence data
In the further analysis, the incidence rate was modeled as
![]() , where d denotes the relevant organ dose. The background rate gamma was described as sex-specific quadratic functions of log (age) further modified by a birth-cohort effect. The parameter beta, the low-dose slope, was modeled as a power function of age, with sex and age-at-exposure effects. The model was fit for a range of assumed theta values, and in each case a measure of the goodness of fit, the deviance, was computed. A plot of the deviance as a function of theta will then show how the data support various extents of curvature. To facilitate interpretation, these plots have been transformed into plots of confidence level as a function of LDEF. Figure 2 shows such plots for both data sets based on analyses with and without adjustment for random errors in the dosimetry. Confidence intervals for the LDEF readily can be obtained from this figure. The results summarized in Figure 2 clearly indicate that only LDEF values near 1 are consistent with the shape of the dose-response curve for solid-tumor incidence. This suggests that a linear model provides a good description of these data and that no low-dose correction is needed.
, where d denotes the relevant organ dose. The background rate gamma was described as sex-specific quadratic functions of log (age) further modified by a birth-cohort effect. The parameter beta, the low-dose slope, was modeled as a power function of age, with sex and age-at-exposure effects. The model was fit for a range of assumed theta values, and in each case a measure of the goodness of fit, the deviance, was computed. A plot of the deviance as a function of theta will then show how the data support various extents of curvature. To facilitate interpretation, these plots have been transformed into plots of confidence level as a function of LDEF. Figure 2 shows such plots for both data sets based on analyses with and without adjustment for random errors in the dosimetry. Confidence intervals for the LDEF readily can be obtained from this figure. The results summarized in Figure 2 clearly indicate that only LDEF values near 1 are consistent with the shape of the dose-response curve for solid-tumor incidence. This suggests that a linear model provides a good description of these data and that no low-dose correction is needed.
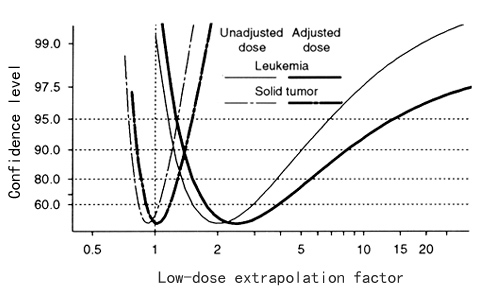
Figure 2. Estimate of low-dose extrapolation factors (LDEF) for solid-tumor and leukemia incidence in the Life Span Study based on both unadjusted and adjusted doses. Confidence levels corresponding to two-sided confidence intervals are plotted against LDEF.
A quite different picture is seen for leukemia incidence. The LDEF is significantly greater than 1, the best fitting values being 2.5, and values as high as 10-15 are not ruled out by the data. Moreover, and unlike the findings for the mortality data, the LDEF for solid tumors and the LDEF for leukemia differ significantly. Further comparisons of the results based on cancer incidence with those based on cancer mortality are provided in Figure 3. For leukemia, the results are quite similar. Also, the best fitting LDEF value for solid-tumor incidence is not that different from the LDEF computed for nonleukemia mortality, but here the confidence interval based on incidence data is much narrower. The evidence for differences in solid-tumor LDEF and leukemia LDEF is, therefore, much stronger in the incidence data, and a combined analysis does not seem appropriate. This suggests that the use of a common LDEF for different endpoints may not be justifiable.
Figure 3. Comparison of 90% confidence intervals for low-dose extrapolation factors based on cancer mortality and cancer incidence. Analysis is based on adjusted doses (LSS cohort, 0-4 Gy). ◆ = maximum likelihood estimate.
Some complicating issues
Some cautionary remarks may be appropriate here. Analysis of the LSS incidence data is complicated by the fact that the survivors may move from the catchment area of the LSS tumor registry. As recommended by R. Sposto and D. Preston (RERF CR 1-92), the migration effects on the risk estimates have been minimized by use of adjusted person-years in the calculations. This method aims at removing biases caused by migration and employs estimates of the residency probability as a function of dose, city, sex, age, and time derived from a subsample of the LSS cohort. Uncertainty in the estimates of recidency probability is not considered in these analyses. The likely effect of this additional uncertainty is to enlarge the confidence intervals slightly. This issue will be addressed in the future.
The shape of the cancer incidence dose response has been studied within the context of linear-quadratic models. Therefore, the relevance of the range of LDEF values depends on the appropriateness of this class of models. It also should be acknowledged that the LDEF values relate to extrapolation of linear risk estimates based on high-dose/high-dose-rate exposures to low-dose/high-dose-rate exposures. The applicability of the results to situations in which the dose rates are low or exposures are highly fractionated is less clear and requires additional assumptions, which cannot be evaluated with the present data.